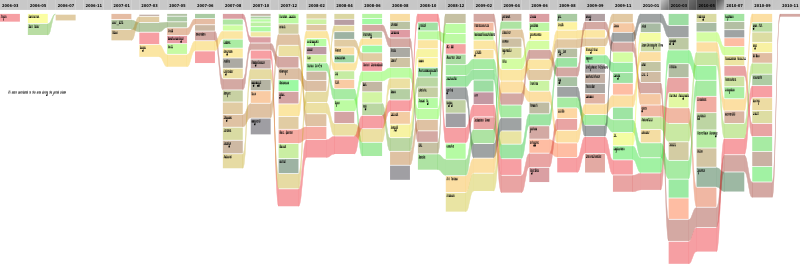
Some experiments with history flow visualization of Openstreetmap contributors for a region. The charts show the most prolific contributors in the region and how contribution volume (not to be confused with quality!) changes over time.
Some examples:
These visualizations require SVG support in your web browser (tested with recent versions of Firefox and Chrome). The wormtrail visualization is implemented in Common Lisp, based on code by Zach Beane. You may download source code to produce your own visualizations. Data is extracted from the experimental full-history planet dumps. Please send suggestions for improvement to ecmarsden@gmail.com.
Eric Marsden, March 2011